
2024 Jobs Report

Occupations Overview
Shifting economic conditions, emerging technologies, and evolving workforce needs continue to shape job opportunities across industries. Understanding these changes is key to navigating the future of work.
This section analyzes key occupational trends using the latest Standard Occupational Classification (SOC) data, including:
- Top Jobs – A curated selection of high-opportunity, high-growth, and career-launching occupations
- Skills in Demand – The technical and soft skills gaining importance
- Earnings & Education Trends – How wages and education levels are evolving
- Workforce Demographics – Diversity and gender balance across industries
- Insights by Occupation – A detailed, interactive view of individual occupations, featuring employment trends, earnings, and workforce demographics
Explore the insights in the below interactive dashboard by
clicking here to align programs, workforce strategies, and talent development efforts with the region’s evolving job market.
Top Jobs by Count
A curated selection of occupations with high employment, offering significant opportunities based on workforce demand
- General and Operations Managers
- Total Jobs (2024): 15,520
- Growth (2014-2024): 52.52%
- Median Hourly Earnings: $49.68
- Hires (2024): 8,069
- Postsecondary Teachers
- Total Jobs (2024): 8,503
- Growth (2014-2024): 6.73%
- Median Hourly Earnings: $37.87
- Hires (2024): 4,062
- Heavy and Tractor-Trailer Truck Drivers
- Total Jobs (2024): 6,455
- Growth (2014-2024): 12.66%
- Median Hourly Earnings: $23.51
- Hires (2024): 5,142
- Business Operations Specialists, All Other
- Total Jobs (2024): 5,916
- Growth (2014-2024): 21.93%
- Median Hourly Earnings: $30.45
- Hires (2024): 2,954
- Accountants and Auditors
- Total Jobs (2024): 4,993
- Growth (2014-2024): 5.98%
- Median Hourly Earnings: $35.21
- Hires (2024): 2,559
- Lawyers
- Total Jobs (2024): 4,543
- Growth (2014-2024): 32.45%
- Median Hourly Earnings: $71.06
- Hires (2024): 996
For more information about these roles, including workforce demographics, top skills, educational and work experience requirements, and typical on-the-job training, explore the Insights by Occupation dashboard below.
Top Jobs by Growth
A curated selection of occupations with exceptional employment expansion over the past decade, reflecting increasing industry demand
- Material Moving Workers, All Other
- Total Jobs (2024): 720
- Growth (2014-2024): 420.72%
- Median Hourly Earnings: $24.50
- Hires (2024): 489
- Designers, All Other
- Total Jobs (2024): 310
- Growth (2014-2024): 353.37%
- Median Hourly Earnings: $35.78
- Hires (2024): 182
- Healthcare Practitioners and Technical Workers, All Other
- Total Jobs (2024): 2,084
- Growth (2014-2024): 239.28%
- Median Hourly Earnings: $30.83
- Hires (2024): 634
- Legal Support Workers, All Other
- Total Jobs (2024): 594
- Growth (2014-2024): 210.46%
- Median Hourly Earnings: $26.87
- Hires (2024): 307
- Chemical Equipment Operators and Tenders
- Total Jobs (2024): 815
- Growth (2014-2024): 198.12%
- Median Hourly Earnings: $39.38
- Hires (2024): 209
- Installation, Maintenance, and Repair Workers, All Other
- Total Jobs (2024): 3,087
- Growth (2014-2024): 189.82%
- Median Hourly Earnings: $24.02
- Hires (2024): 1,906
For more information about these roles, including workforce demographics, top skills, educational and work experience requirements, and typical on-the-job training, explore the Insights by Occupation dashboard below.
Top On-Ramp Jobs
A curated selection of occupations that serve as entry points to high-growth, high-wage roles, offering pathways to career advancement
- Secretaries and Administrative Assistants, Except Legal, Medical, and Executive
- Total Jobs (2024): 11,835
- Growth (2014-2024): 11.40%
- Median Hourly Earnings: $18.19
- Hires (2024): 7,791
- Customer Service Representatives
- Total Jobs (2024): 9,345
- Growth (2014-2024): 41.06%
- Median Hourly Earnings: $17.72
- Hires (2024): 7,902
- Maintenance and Repair Workers, General
- Total Jobs (2024): 7,292
- Growth (2014-2024): 12.15%
- Median Hourly Earnings: $19.14
- Hires (2024): 3,867
- Light Truck Drivers
- Total Jobs (2024): 4,744
- Growth (2014-2024): 20.76%
- Median Hourly Earnings: $18.47
- Hires (2024): 4,383
- Sales Representatives of Services, Except Advertising, Insurance, Financial Services, and Travel
- Total Jobs (2024): 2,593
- Growth (2014-2024): 17.00%
- Median Hourly Earnings: $23.06
- Hires (2024): 1,850
- Sailors and Marine Oilers
- Total Jobs (2024): 2,484
- Growth (2014-2024): 11.30%
- Median Hourly Earnings: $22.18
- Hires (2024): 1,518
For more information about these roles, including workforce demographics, top skills, educational and work experience requirements, and typical on-the-job training, explore the Insights by Occupation dashboard below.
Skills in Demand
Industries and employers continue to value certain skill sets over others, but why these skills are becoming more important varies by sector. Below are the top skills by type along with possible reasons why different skills are gaining traction.
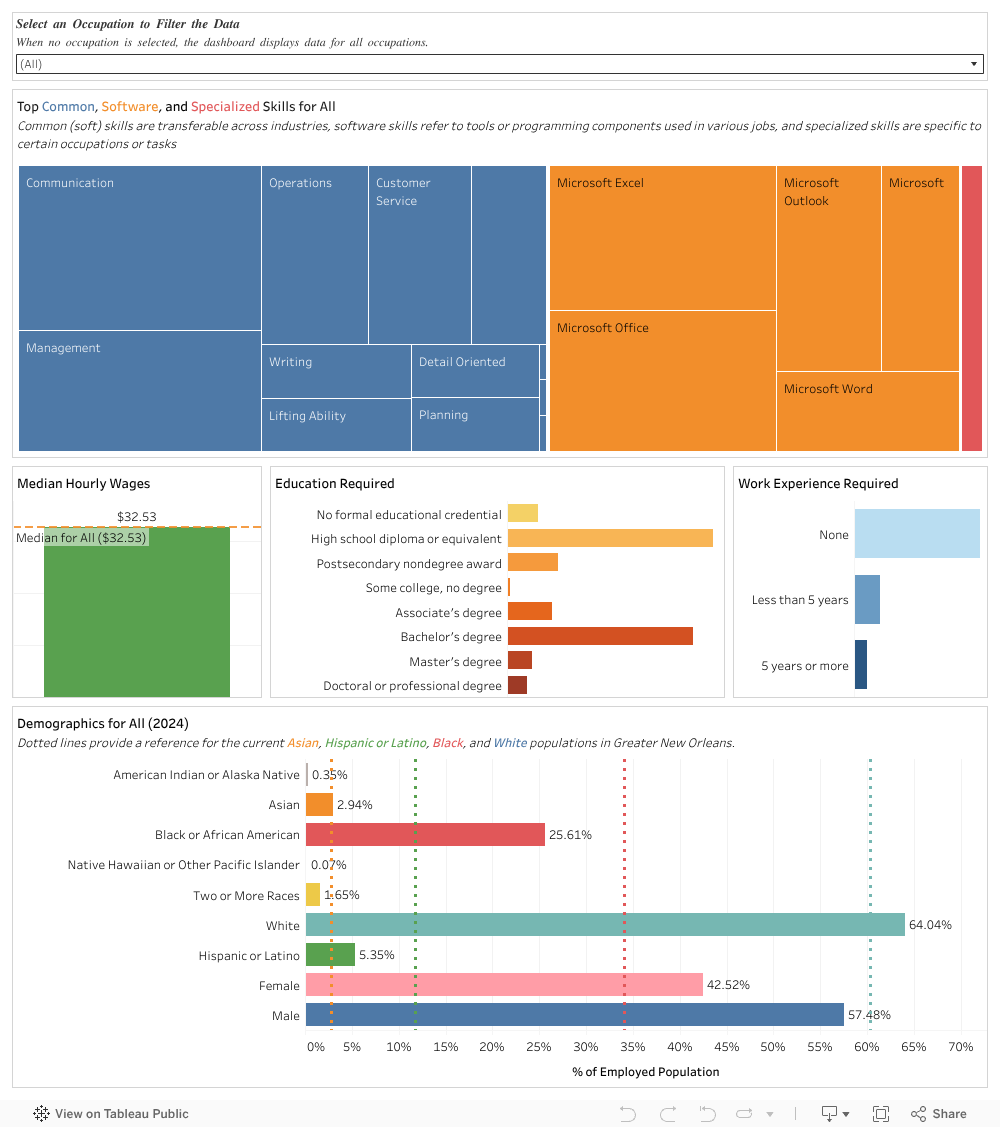
Top Common (Soft) Skills
As automation takes over repetitive tasks, employers may be placing a stronger emphasis on skills that machines can’t replicate, including:
- Communication
- Adaptability
- Critical Thinking
Top Software (Technical) Skills
Many industries are adopting more digital tools and data-driven strategies, making technical proficiency increasingly valuable, such as:
- Data Analysis (Excel, SQL, Tableau) – Often sought after in business and finance roles
- Customer Relationship Management (CRM software) – Important for sales and service-based industries
- Warehouse Management Systems – Essential for logistics, retail, and e-commerce
Top Specialized (Industry-Specific) Skills
As industries adapt to new challenges, they need workers with more specialized knowledge, including:
- Supply Chain & Inventory Management – Likely in response to increased e-commerce and global trade shifts
- Digital Marketing & E-commerce Strategies – As businesses move more online, these skills could be helping companies stay competitive
- Healthcare Support & Patient Care – With an aging population and ongoing public health concerns, healthcare roles may require more specialized knowledge
Education Requirements

Most top jobs (50.7%) require a non-degree certificate or less, while 40.8% need an associate or bachelor’s degree. Only 8.0% require a master’s or doctorate.
The data suggests that most top jobs are accessible without a four-year degree, highlighting opportunities for job seekers with technical training and emphasizing the need for workforce developers to expand skill-based education and certification programs.
Work Experience

The majority of top jobs (76.1%) require no prior work experience, while 15.9% require 1–5 years and only 8.0% demand five or more years.
This trend highlights abundant entry-level opportunities for job seekers and underscores the importance of workforce developers supporting skill-building and career pathways.
Additionally, it suggests that there are significant opportunities for individuals to gain experience and advance their careers quickly, especially in high-growth sectors. This is an encouraging sign for educational institutions and HR leaders to focus on foundational skills and entry-level job training that can lead to long-term career success.
Workforce Demographics

White and male workers are overrepresented in the occupations featured in this report, especially in Installation, Maintenance, and Repair; Construction and Extraction; and Transportation and Material Moving roles, where 90% of workers are male and 63.37% are white.
The most diverse workforces are found in Community and Social Service, Building and Grounds Cleaning and Maintenance, Office and Administrative Support, Farming, Fishing, and Forestry, and Transportation and Material Moving occupations, with diversity rates ranging from 45.87% to 58.67%.
The data also shows significant earnings disparities: in the top 25 highest-paying jobs, 63.74% are male and 73.97% are white. Median hourly earnings for the top ten occupations with the highest representation of Black residents are $22.97, $20.66 for Hispanic residents, and $46.79 for White residents.
These disparities underscore the need for targeted equity and inclusion efforts to bridge the earnings gap and create equal opportunities for all workers.
Insights by Occupation
While the previous section explored broader occupational trends, this interactive dashboard offers a more detailed view of individual jobs using the latest Standard Occupational Classification (SOC) data. SOC codes categorize occupations based on their functions. Explore employment trends, earnings, and workforce demographics by occupation.
Explore by Section
The 2024 Greater New Orleans Jobs Report has analyzed data on the overall regional economy, as well as key industries and occupations which drive it. Explore this data below:


